Performance Marketing
Marginal ROAS tells the truth that Blended ROAS won't admit
Your blended ROAS reacts slowly as you keep ramping up Ad-Spend, even while the last dollars you add have stopped paying for themselves.
Marginal ROAS and the saturation curve tell you exactly when to keep scaling and when to stop.
BooleanMaths Research · 9 min read
You scaled Meta spend from $20k to $25k last month.
Blended ROAS barely moved - from 3.0 down to 2.7, it is still above your 2.5 breakeven.
So it looks like a clean win.
But if you look at the money you actually added: that extra $5k brought in $7.5k of revenue.
The marginal return on it was 1.5, not 2.7 - and you needed 2.5 just to break even on that spend.
You didn't scale a winner.
The last $5k produced $7.5k revenue but incurred $12.5K in Direct Costs and Ad Spend. So, you ended up losing $5K.
Total ROAS answers one question: how did all my spend perform together?
Marginal ROAS answers a far more useful one: what did the last dollar I added actually earn - and what will the next one earn? Every scaling decision, every budget cut, every "should I push harder on this campaign" is a marginal question.
Almost nobody measures it that way.
The reason this matters is structural. Ad channels don't return the same rate at every spend level.
The first few dollars are spent in learning and have a low response.
Past the learning phase, your Ad Spend hits your most responsive, cheapest-to-reach audience.
As you spend more, you reach less interested people, at higher frequency, at a higher auction price. Returns diminish.
But your average ROAS moves slowly. It is still aggregating all efficient spend that came before - so the dashboard looks stable long after the money you're adding at the edge has stopped paying for itself.
Scale on the average and you will always overspend: you keep pushing budget into a campaign that still reads a healthy 2.7 while the money you're adding returns 1.5. Cut on the average and you do the opposite pulling budget off a campaign whose marginal return was still comfortably above breakeven. Both mistakes come from reading the wrong number.
THE FORMULA
Marginal ROAS = Δ Revenue ÷ Δ Spend
The change in revenue divided by the change in spend, between two spend levels. Lifting spend from $20k to $25k took revenue from $60k to $67.5k .
So your marginal ROAS on that extra $5k is 7.5 ÷ 5 = 1.5
Even as blended ROAS only slips from 3.0 to 2.7, the marginal ROAS gives you a clear signal.
Average vs Marginal:
Two Different Slopes of the Same Curve,
Your ROAS saturation curve bends the same way for almost every channel:
steep at first, then flattening as you spend into a finite audience.
Two numbers live on it.
Average ROAS is the slope of the line from the origin;
marginal ROAS is the slope of the tangent where you're standing.
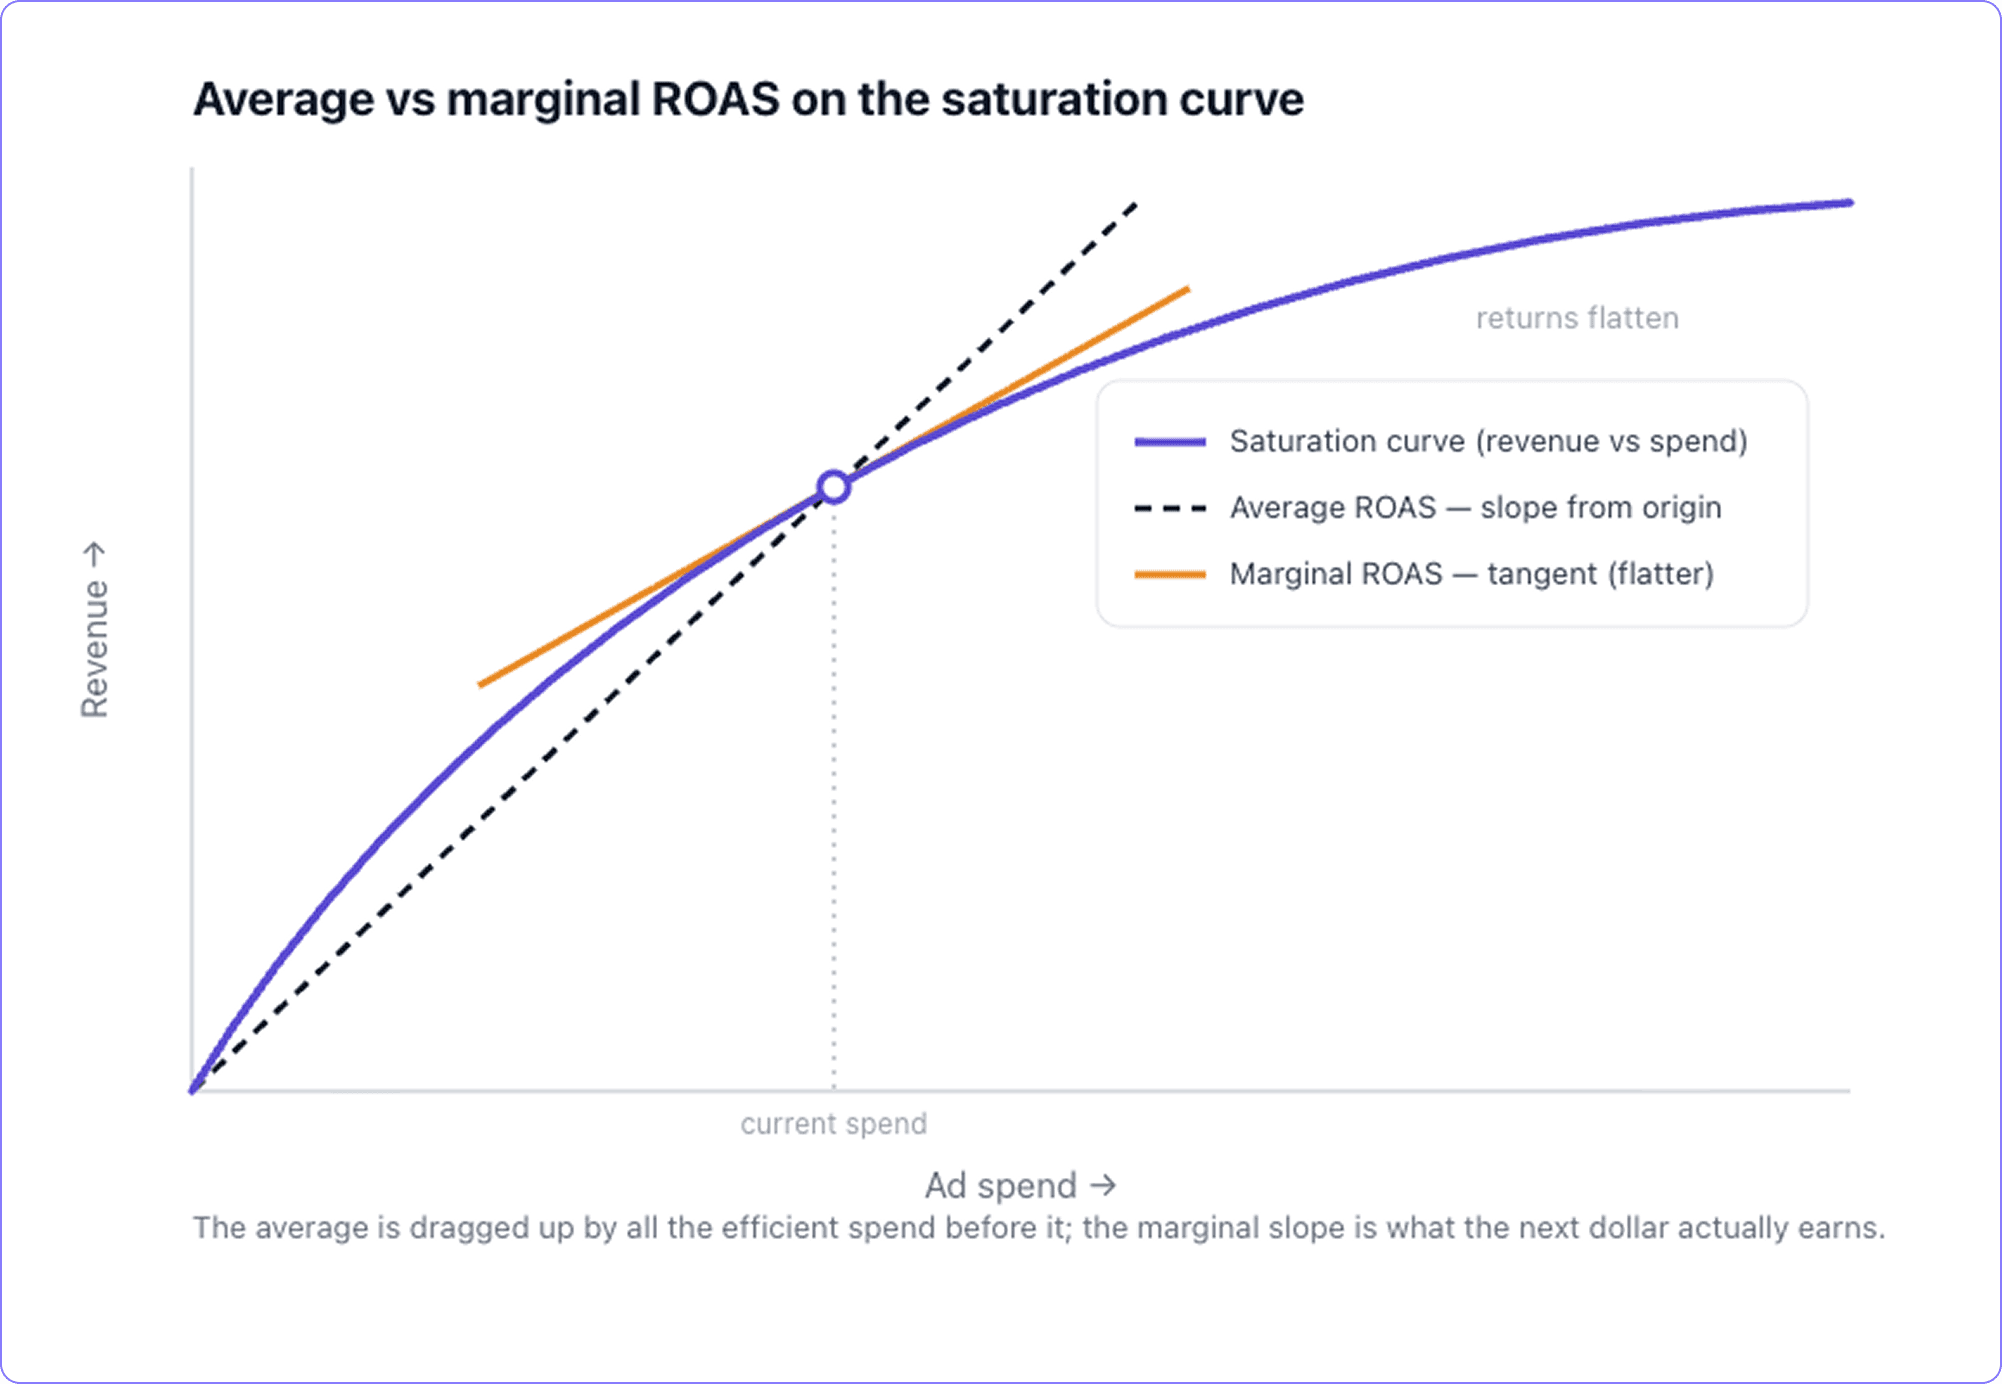
Many curves also have an early S-shape: at very low budgets, marginal returns can actually rise for a while as the algorithm exits its learning phase and you clear minimum-efficient-scale. That's the region where scaling genuinely compounds. The job is to recognise where that region ends and the flattening begins - because that turning point, not your average ROAS, is the real signal.
THE ANALOGY
It's an orange, not a tap
Average ROAS treats your channel like a tap: turn it more, get proportionally more juice. It isn't a tap — it's an orange. The first squeeze gives you most of the juice for the effort. The fifth gives a trickle. The tenth gives a few drops for the same squeeze.
If you decide only based on the total juice in the glass, you'll keep squeezing long after the orange is dry. You stop when the next squeeze isn't worth it. That's marginal thinking, and it's the only thinking that tells you when to stop.
Why the Curve Flattens: Five Mechanisms of Saturation
Five forces bend the curve. The first is the base mechanism; the rest accelerate it.
01
A finite addressable audience
Only so many people are in-market for your product this month. You reach the eager ones first and cheaply. Every additional rupee has to buy attention from someone less interested than the last person. So each rupee converts a little worse than the one before it. Everything below accelerates this.
02
Frequency and fatigue
As you spend more into the same audience, the same people see your ads more often. The first few impressions do the work; the tenth mostly wastes money and starts to annoy. Rising frequency at flat reach is one of the clearest early signs your curve is about to bend.
03
Auction price inflation
To spend more, you bid for inventory you were winning cheaply and for inventory you were losing. Your CPMs rise as you climb. So even if conversion rate held perfectly steady, ROAS would fall simply because each impression now costs more. You pay up the auction to reach a worse audience - a double penalty.
04
Creative saturation
A single winning creative has a finite audience before wear-out. Pushed hard without fresh assets, its response decays fast. Brands with a deep, constantly-refreshed creative pipeline sit on a much gentler saturation curve than brands riding one hero ad - same spend, very different marginal returns.
05
Bleed into your existing customers
As a prospecting campaign scales past the genuinely-new audience, the algorithm - chasing the easiest conversions - starts serving your existing and warm customers. Those orders convert cheaply and hold your blended ROAS up, which is exactly why the average looks fine. But your new-customer marginal ROAS has already collapsed. You're scaling an acquisition budget that has quietly stopped acquiring.
The Number You're Actually Optimising Toward
Here's the part most brands skip: the goal is not to maximise ROAS. It's to spend up to the point where the next dollar still earns its margin and not a dollar past it.
THE FORMULA
Breakeven marginal ROAS = 1 ÷ Contribution margin
If your contribution margin after COGS, shipping, payment fees and returns is 40%, your breakeven marginal ROAS is 1 ÷ 0.40 = 2.5.
As long as the next dollar returns more than 2.5, it makes you money. Keep spending.
The moment marginal ROAS drops below 2.5, every additional dollar destroys contribution, even while your blended ROAS maybe higher.
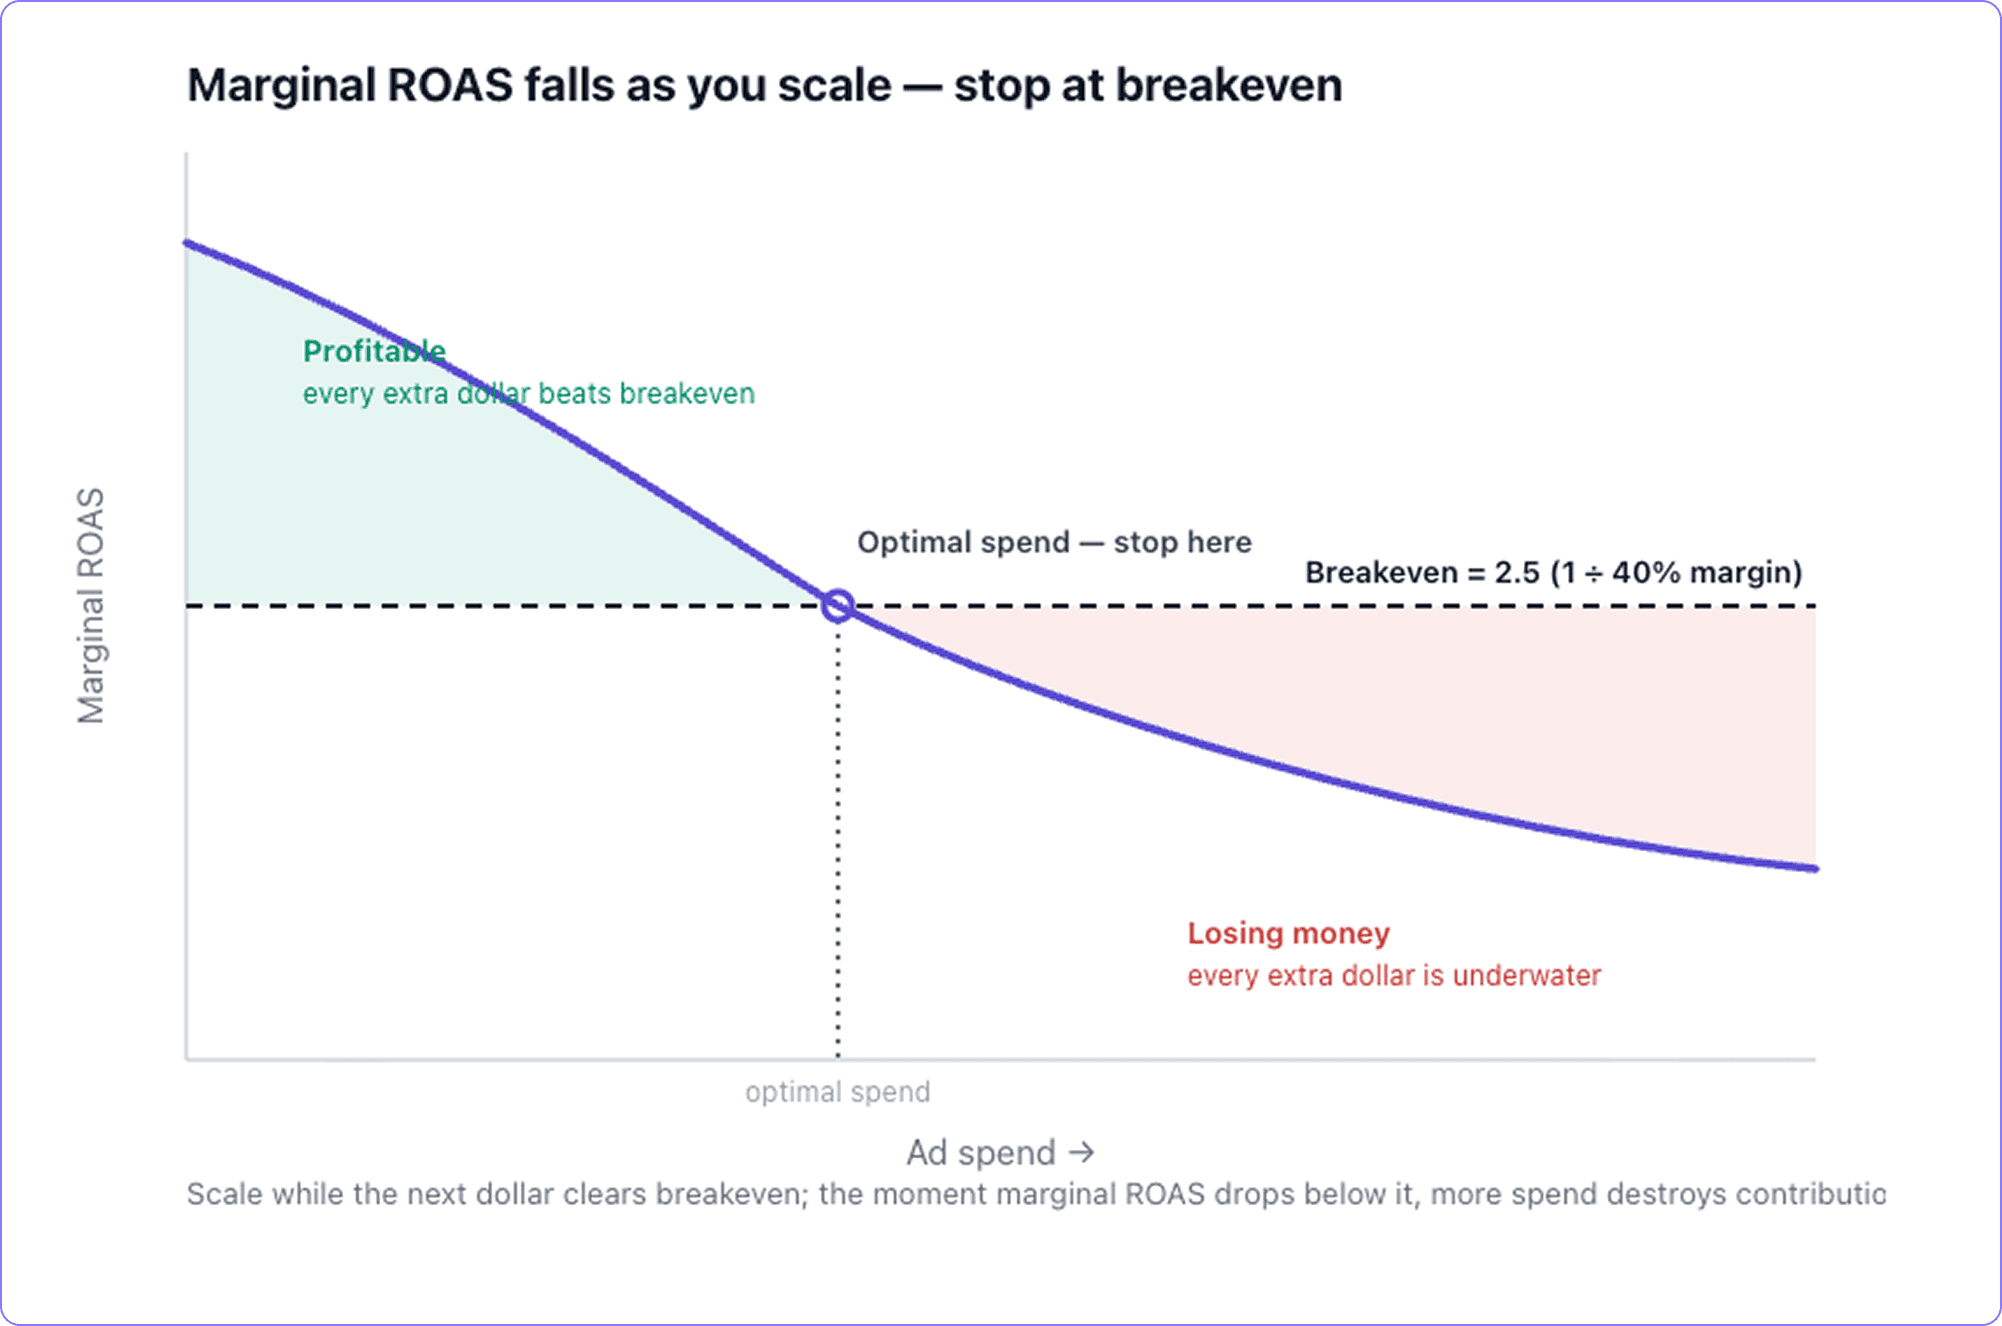
This reframes the whole decision. You are not hunting for the highest ROAS. You are scaling down the saturation curve, deliberately, until marginal ROAS meets your breakeven line - because every point between "highly efficient" and "breakeven" is still profitable growth you'd leave on the table by stopping early.
Two adjustments make this real for a D2C brand.
Use delivered, net revenue - not gross order value
If COD and RTO mean 18% of your "revenue" never gets delivered, a saturation curve built on gross orders is a fantasy. Build the curve on contribution after returns, or it will tell you to scale straight into losses.
For acquisition, credit the LTV
If your 12-month LTV is 3x first-order value, the acquisition budget can rationally run at a lower marginal ROAS than the strict first-order breakeven - the same logic that lets a healthy NC ROAS sit at 1.2–1.5. Just make that a deliberate, LTV-backed decision, not an accident of watching the blended number.
You Can't Read Marginal ROAS Off a Dashboard
The uncomfortable truth: no ad platform shows you your marginal ROAS, and the numbers they do show make it worse. Platform-reported ROAS is over-attributed — it claims organic, retargeting, and view-through halo as its own. A saturation curve drawn from Meta's or Google's reported revenue is inflated, and its slope overstates your true marginal return. You'll think you have room to scale when you don't. Three ways to actually find the curve:
Budget-step tests
Move spend in controlled steps and watch incremental delivered revenue, not blended ROAS. Hold spend, lift it 20–30%, hold again, and measure the delta in net revenue against the delta in spend. Do it deliberately enough times and you've mapped your own curve, one segment at a time.
Geo and holdout incrementality
The cleanest read on marginal return: hold out a region or audience, spend more in the rest, and measure the lift that spend actually caused rather than what a pixel claimed. This strips out the halo the platforms take credit for.
Media Mix Modeling
MMM fits saturation curves statistically across your historical spend variation, giving you a modelled response curve and marginal ROAS per channel — without pausing anything. It's the fastest way to see where each channel sits on its curve today and how much headroom is left before breakeven. BooleanMaths builds this on your delivered-revenue and contribution data, so the curve is drawn on money that actually landed, not on platform-attributed gross.
The misread this all prevents
If your campaign has a high blended ROAS and a low marginal ROAS, you don't have a campaign with room to scale. You have a campaign that already scaled past its profitable point and is being propped up by the efficient spend underneath it.
Find the curve. Find your breakeven. Spend to the point — not past it.
Activate your Marketing Data with BooleanMaths