Case study · Meta Ads
One clean data feed cut Meta's over-attribution from 4.5x to 1.6x
A D2C apparel brand in India had four sources feeding its Meta pixel, so Meta took credit for more orders than the whole brand made. On Sep 18, the brand kept BooleanMaths CAPI as the only purchase feed. Meta's over-attribution collapsed the next day and has held, while Google, left untouched, stayed flat.
1.6x
orders Meta reports per order it drives, down from 4.5x
₹89K
of phantom revenue removed from Meta's reporting every day
1.37x
true Meta ROAS, up from 1.20x at the same spend
1.3x
Google over-attribution before and after, an in-account control
In short
Meta was reporting 79 orders a day while driving about 18. After the brand removed three overlapping purchase feeds and kept BooleanMaths CAPI as the single source, Meta's reported orders fell to 27 a day with the same spend and the same true orders. That is about ₹89K a day, or roughly ₹26.6L a month, of revenue Meta's dashboard no longer invents. Budget decisions now follow real performance instead of phantom ROAS.
The problem
Four sources. One pixel. Every order counted more than once.
Shopflo checkout, the Appbrew mobile app, the Facebook and Instagram app integrations and BooleanMaths CAPI all sent purchases to the same Meta pixel. Orders could arrive more than once, and app purchases arrived too, so Meta could claim credit for them. Over the three weeks before the fix, Meta claimed about 79 orders a day. The whole brand, app included, made about 73 a day, and the website about 52. Meta's daily inflation ranged from 2.9x to 6.4x, and in the week of Sep 11 to 17, Meta and Google together claimed 138% of all brand orders.
Against the brand's 4.5x ROAS target, Meta's dashboard showed 5.86x, which reads as "scale." BooleanMaths showed a true ROAS of 1.20x, well below target. Any budget call made inside Ads Manager was being steered by revenue that didn't exist.
The fix
One clean, deduplicated purchase feed.
On Sep 18, the brand switched off the Shopflo, Appbrew and Facebook/Instagram app dataflows and kept BooleanMaths CAPI as the only purchase source. Meta and Google now receive web orders only, deduplicated by order ID. The feed is healthy: from Sep 11 to 24, BooleanMaths sent 2.43 lakh events at 100% success, including 660 purchases, about 51 a day and in line with web order volume. Order ID, browser ID, IP and user agent cover 94 to 100% of events.

The setup
Case study setup
One D2C apparel brand in India, selling on its Shopify website and mobile app, with Meta and Google as its main paid channels. We compared three weeks with overlapping feeds against the first clean week, using BooleanMaths linear-touch attribution as the source of truth.
~73 orders / day
Across web and app. Around 52 a day come through the website, which is all Meta can actually influence through the pixel.
Before: Aug 28 – Sep 17
21 days with Shopflo, Appbrew, the FB/IG app integrations and BooleanMaths CAPI all feeding the same Meta pixel.
After: Sep 19 – 24
Results - measurement
The gap closed overnight, and stayed closed.
Meta's over-attribution ran between 2.9x and 6.4x a day for three weeks. It fell to 2.4x on the partial day of the cleanup and has stayed between 1.4x and 1.8x since. Spend and true orders held steady, so the drop is in what Meta reports, not in what it drives. Google, which the change didn't touch, stayed around 1.3x throughout, which rules out a tracking or seasonal shift.
Platform-reported orders per true order, daily, Aug 28 – Sep 24, 2026. 1.0x means the platform reports exactly what BooleanMaths attributes.


Results - what changed
Same spend, same orders. Only the reporting moved.
Figures are daily averages from the brand's BooleanMaths workspace. True orders and revenue use linear-touch attribution; platform figures are what Meta reports through its API.
Before and after, at a glance
Meta · Aug 28 – Sep 17 vs Sep 19 – 24
Meta's reported orders fell from 79.3 to 27.3 a day while spend (₹22.7K to ₹23.7K) and true orders (17.7 to 17.4) held steady. Platform ROAS dropped from 5.86x to 2.08x, closer to the true 1.37x. Phantom revenue fell from ₹1.06L to ₹17.0K a day, about ₹26.6L a month that Meta's dashboard no longer invents.

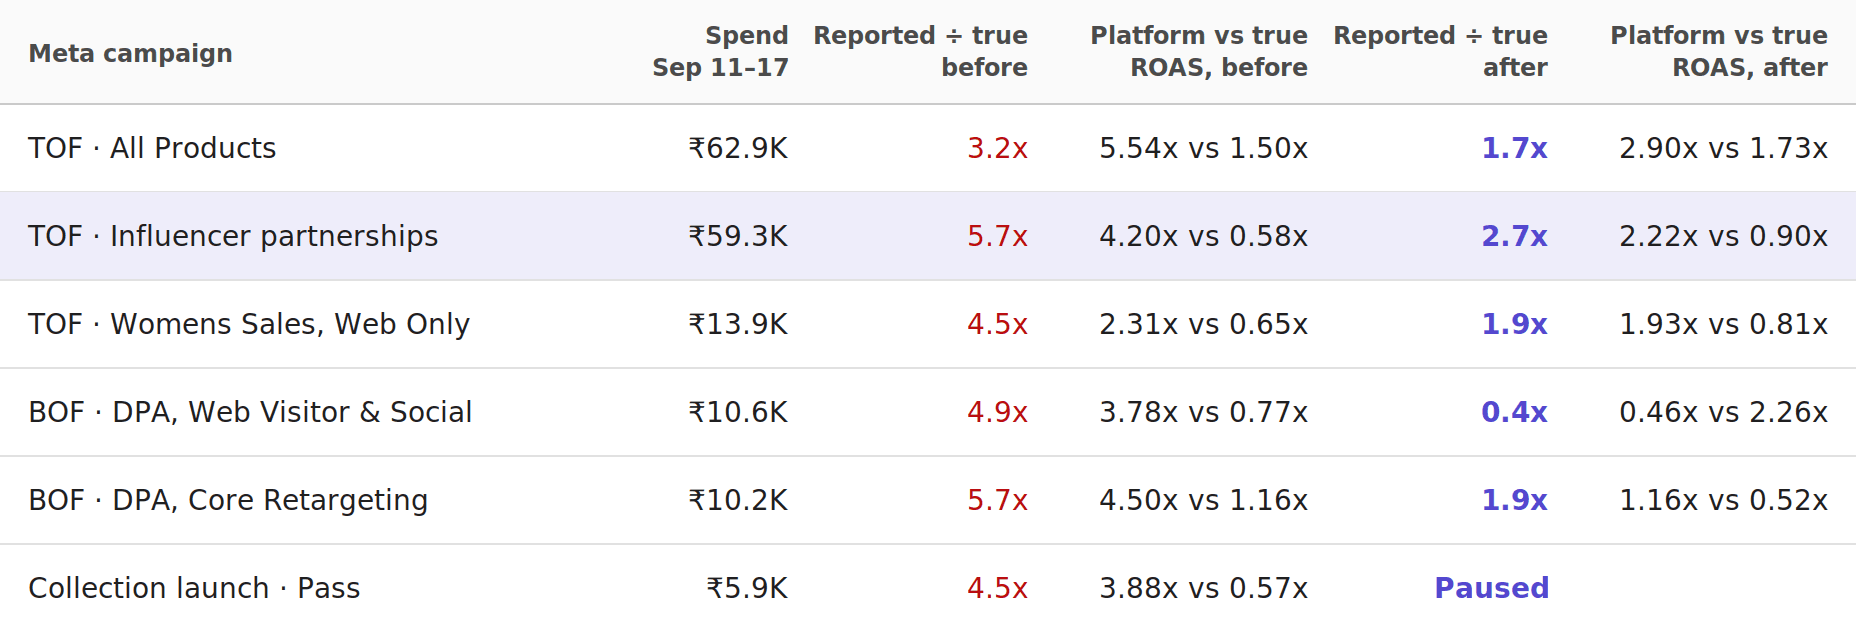
Where the phantom revenue was hiding
Meta campaigns · Sep 11 – 17 vs Sep 18 – 24
Retargeting and influencer campaigns were the most inflated, at 4.9x to 5.7x. They reach existing customers who then often buy in the app, exactly the signal that used to leak into the pixel. The influencer campaign showed 4.2x ROAS on ₹59K a week, close to the 4.5x target. Its true ROAS was 0.58x.
Why this is a clean result
Controls · Sep 17 – 24
The break is sharp and dated: Sep 17 was 3.4x, the partial day of Sep 18 was 2.4x, and every day since has been under 1.9x. Real activity didn't change, since Meta spend and true orders were steady. And Google works as an in-account control: its ratio was 1.30x before and 1.28x after, so a tracking or seasonal shift would have shown up there too.
Business impact
Budget now moves the way the true numbers point.
01
Influencer spend cut 25%
The campaign that looked close to target at 4.2x platform ROAS was truly returning 0.58x. Its weekly spend came down from ₹59.3K to ₹44.2K, and its true ROAS rose to 0.90x.
02
Budget moved to the best true performer
The All Products campaign went from ₹62.9K to ₹69.6K a week, and its true ROAS rose from 1.50x to 1.73x. Core retargeting roughly halved, from ₹10.2K to ₹5.8K, and a collection-launch campaign returning 0.57x was paused.
03
Meta learns from a cleaner signal
Meta used to learn from app purchases and duplicates, which rewards reaching people who would buy anyway. It now learns only from deduplicated web purchases it can plausibly influence, and several ad sets moved to value optimization on real order values.
Methodology. All figures come from the brand's BooleanMaths workspace, pulled Sep 25, 2026. True orders and revenue use linear-touch attribution, a 60-day window, stitched journeys and order date. Over-attribution is platform-reported orders divided by true orders for the same channel and days; phantom revenue is platform-reported revenue minus true revenue. Before is Aug 28 – Sep 17 (21 days); after is Sep 19 – 24 (6 days), leaving out Sep 18 as the transition day. Campaign comparisons use Sep 11 – 17 against Sep 18 – 24. Values in ₹. The brand is withheld.